Forecast
Forecast tables for 2017–2020 (December 2017)
See forecast tables for the Finnish economy in 2017–2020 (December 2017).
December 2017
| 1. BALANCE OF SUPPLY AND DEMAND, AT REFERENCE YEAR 2010 PRICES | |||||
| % change on previous year | |||||
| 2016 | 2017f | 2018f | 2019f | 2020f | |
| GDP at market prices | 1.9 | 3.1 | 2.5 | 1.6 | 1.4 |
| Imports of goods and services | 4.4 | 2.2 | 3.4 | 2.9 | 2.7 |
| Exports of goods and services | 1.3 | 8.4 | 3.8 | 3.5 | 3.0 |
| Private consumption | 1.8 | 1.9 | 1.8 | 1.3 | 1.2 |
| Public consumption | 1.2 | 0.5 | 0.7 | 0.1 | 0.4 |
| Private fixed investment | 7.9 | 11.2 | 5.8 | 3.2 | 2.5 |
| Public fixed investment | 3.9 | –1.1 | 3.3 | –0.5 | 1.2 |
| Source: Bank of Finland. | |||||
| 2. CONTRIBUTIONS TO GROWTH1 | |||||
| 2016 | 2017f | 2018f | 2019f | 2020f | |
| GDP, % change | 1.9 | 3.1 | 2.5 | 1.6 | 1.4 |
| Net exports | –1.2 | 2.2 | 0.2 | 0.2 | 0.1 |
| Domestic demand excl. inventory change | 2.8 | 3.1 | 2.4 | 1.3 | 1.3 |
| of which Consumption | 1.3 | 1.2 | 1.1 | 0.7 | 0.7 |
| Investment | 1.5 | 1.9 | 1.2 | 0.6 | 0.6 |
| Inventory change + statistical discrepancy | 0.4 | –2.2 | 0.0 | 0.0 | 0.0 |
| 1 Bank of Finland calculations. Annual growth rates using the previous year's GDP shares at current prices as weights. | |||||
| Source: Bank of Finland. | |||||
| 3. BALANCE OF SUPPLY AND DEMAND, PRICE DEFLATORS | |||||
| Index 2010 = 100, and % change on previous year | |||||
| 2016 | 2017f | 2018f | 2019f | 2020f | |
| GDP at market prices | 113.4 | 114.9 | 116.9 | 118.5 | 120.8 |
| 0.9 | 1.3 | 1.8 | 1.4 | 1.9 | |
| Imports of goods and services | 97.6 | 101.3 | 103.6 | 105.9 | 107.8 |
| –2.8 | 3.8 | 2.2 | 2.2 | 1.8 | |
| Exports of goods and services | 101.2 | 104.2 | 107.1 | 109.0 | 111.1 |
| –1.9 | 3.0 | 2.8 | 1.8 | 1.9 | |
| Private consumption | 111.5 | 112.4 | 113.8 | 115.5 | 117.3 |
| 0.9 | 0.8 | 1.2 | 1.5 | 1.5 | |
| Public consumption | 113.3 | 111.5 | 113.1 | 114.7 | 117.7 |
| 0.0 | –1.6 | 1.5 | 1.4 | 2.6 | |
| Private fixed investment | 111.1 | 113.4 | 115.8 | 117.9 | 120.4 |
| 1.5 | 2.0 | 2.1 | 1.8 | 2.2 | |
| Public fixed investment | 111.5 | 113.5 | 116.0 | 118.5 | 121.1 |
| 1.1 | 1.8 | 2.2 | 2.2 | 2.1 | |
| Terms of trade (goods and services) | 103.7 | 102.9 | 103.4 | 103.0 | 103.0 |
| 1.0 | –0.8 | 0.5 | –0.5 | 0.1 | |
| Source: Bank of Finland. | |||||
| 4. BALANCE OF SUPPLY AND DEMAND, AT CURRENT PRICES | |||||
| EUR million and % change on previous year | |||||
| 2016 | 2017f | 2018f | 2019f | 2020f | |
| GDP at market prices | 215,615 | 225,200 | 235,104 | 242,162 | 250,380 |
| 2.9 | 4.4 | 4.4 | 3.0 | 3.4 | |
| Imports of goods and services | 78,616 | 83,412 | 88,165 | 92,788 | 97,059 |
| 1.5 | 6.1 | 5.7 | 5.2 | 4.6 | |
| Total supply | 294,231 | 308,612 | 323,269 | 334,950 | 347,439 |
| 2.5 | 4.9 | 4.7 | 3.6 | 3.7 | |
| Exports of goods and services | 75,967 | 84,847 | 90,473 | 95,293 | 99,995 |
| –0.6 | 11.7 | 6.6 | 5.3 | 4.9 | |
| Consumption | 170,771 | 173,468 | 178,307 | 182,671 | 187,819 |
| 2.3 | 1.6 | 2.8 | 2.4 | 2.8 | |
| Private | 119,056 | 122,327 | 126,050 | 129,625 | 133,192 |
| 2.8 | 2.7 | 3.0 | 2.8 | 2.8 | |
| Public | 51,715 | 51,141 | 52,257 | 53,046 | 54,626 |
| 1.2 | –1.1 | 2.2 | 1.5 | 3.0 | |
| Fixed investment | 46,423 | 51,577 | 55,519 | 58,007 | 60,633 |
| 8.7 | 11.1 | 7.6 | 4.5 | 4.5 | |
| Private | 37,860 | 42,955 | 46,423 | 48,753 | 51,070 |
| 9.5 | 13.5 | 8.1 | 5.0 | 4.8 | |
| Public | 8,563 | 8,623 | 9,096 | 9,254 | 9,563 |
| 5.1 | 0.7 | 5.5 | 1.7 | 3.3 | |
| Inventory change + statistical discrepancy | 1,070 | –1,280 | –1,031 | –1,021 | –1,008 |
| % of previous year's total demand | 0.0 | –0.8 | 0.1 | 0.0 | 0.0 |
| Total demand | 294,231 | 308,612 | 323,269 | 334,950 | 347,439 |
| 2.5 | 4.9 | 4.7 | 3.6 | 3.7 | |
| Total domestic demand | 218,264 | 223,765 | 232,796 | 239,657 | 247,443 |
| 3.6 | 2.5 | 4.0 | 2.9 | 3.2 | |
| Source: Bank of Finland. | |||||
| 5. BALANCE OF SUPPLY AND DEMAND | |||||
| % of GDP at current prices | |||||
| 2016 | 2017f | 2018f | 2019f | 2020f | |
| GDP at market prices | 100.0 | 100.0 | 100.0 | 100.0 | 100.0 |
| Imports of goods and services | 36.5 | 37.0 | 37.5 | 38.3 | 38.8 |
| Exports of goods and services | 35.2 | 37.7 | 38.5 | 39.4 | 39.9 |
| Consumption | 79.2 | 77.0 | 75.8 | 75.4 | 75.0 |
| Private | 55.2 | 54.3 | 53.6 | 53.5 | 53.2 |
| Public | 24.0 | 22.7 | 22.2 | 21.9 | 21.8 |
| Fixed investment | 21.5 | 22.9 | 23.6 | 24.0 | 24.2 |
| Private | 17.6 | 19.1 | 19.7 | 20.1 | 20.4 |
| Public | 4.0 | 3.8 | 3.9 | 3.8 | 3.8 |
| Inventory change + statistical discrepancy, | 0.5 | –0.6 | –0.4 | –0.4 | –0.4 |
| Total demand | 136.5 | 137.0 | 137.5 | 138.3 | 138.8 |
| Total domestic demand | 101.2 | 99.4 | 99.0 | 99.0 | 98.8 |
| Source: Bank of Finland. | |||||
| 6. PRICES | |||||
| Index 2010 = 100, and % change on previous year | |||||
| 2016 | 2017f | 2018f | 2019f | 2020f | |
| Harmonised index of consumer prices, 2005=100 | 100.4 | 101.2 | 102.3 | 103.8 | 105.3 |
| 0.4 | 0.8 | 1.1 | 1.4 | 1.5 | |
| Consumer price index, 2005=100 | 100.4 | 101.1 | 102.1 | 103.5 | 105.0 |
| 0.4 | 0.7 | 1.0 | 1.3 | 1.5 | |
| Private consumption deflator | 111.5 | 112.4 | 113.8 | 115.5 | 117.3 |
| 0.9 | 0.8 | 1.2 | 1.5 | 1.5 | |
| Private investment deflator | 111.1 | 113.4 | 115.8 | 117.9 | 120.4 |
| 1.5 | 2.0 | 2.1 | 1.8 | 2.2 | |
| Exports of goods and services deflator | 101.2 | 104.2 | 107.1 | 109.0 | 111.1 |
| –1.9 | 3.0 | 2.8 | 1.8 | 1.9 | |
| Imports of goods and services deflator | 97.6 | 101.3 | 103.6 | 105.9 | 107.8 |
| –2.8 | 3.8 | 2.2 | 2.2 | 1.8 | |
| Value-added deflators | |||||
| Value-added, gross at basic prices | 113.3 | 113.8 | 115.5 | 117.1 | 119.0 |
| 1.0 | 0.4 | 1.5 | 1.4 | 1.6 | |
| Private sector | 112.8 | 113.7 | 115.4 | 117.0 | 118.7 |
| 1.3 | 0.8 | 1.5 | 1.4 | 1.4 | |
| Public sector | 115.3 | 113.9 | 115.6 | 117.2 | 120.3 |
| –0.3 | –1.2 | 1.5 | 1.4 | 2.6 | |
| Source: Bank of Finland. | |||||
| 7. WAGES AND PRODUCTIVITY | |||||
| % change on previous year | |||||
| 2016 | 2017f | 2018f | 2019f | 2020f | |
| Whole economy | |||||
| Index of wage and salary earnings | 0.9 | 0.2 | 2.3 | 2.3 | 2.4 |
| Compensation per employee | 1.0 | –0.6 | 1.3 | 2.0 | 2.8 |
| Unit labour costs | –0.5 | –2.8 | –0.4 | 1.0 | 1.7 |
| Labour productivity per employed person | 1.5 | 2.3 | 1.8 | 1.1 | 1.1 |
| Source: Bank of Finland. | |||||
| 8. LABOUR MARKET | |||||
| 1,000 persons and % change on previous year | |||||
| 2016 | 2017f | 2018f | 2019f | 2020f | |
| Labour force survey (15–74-year-olds) | |||||
| Employed persons | 2,447 | 2,466 | 2,485 | 2,498 | 2,507 |
| 0.4 | 0.8 | 0.8 | 0.5 | 0.4 | |
| Unemployed persons | 236 | 232 | 220 | 214 | 206 |
| –6.4 | –1.8 | –4.8 | –3.0 | –3.5 | |
| Labour force | 2,683 | 2,698 | 2,705 | 2,712 | 2,713 |
| –0.2 | 0.5 | 0.3 | 0.3 | 0.0 | |
| Working–age population (15–64-year-olds) | 3,463 | 3,452 | 3,445 | 3,438 | 3,432 |
| –0.4 | –0.3 | –0.2 | –0.2 | –0.2 | |
| Labour force participation rate, % | 65.3 | 65.5 | 65.5 | 65.5 | 65.6 |
| Unemployment rate, % | 8.8 | 8.6 | 8.2 | 7.9 | 7.6 |
| Employment rate (15–64-year-olds), % | 68.7 | 69.3 | 69.9 | 70.4 | 70.7 |
| Source: Bank of Finland. | |||||
| 9. GENERAL GOVERNMENT REVENUE, EXPENDITURE, BALANCE AND DEBT | |||||
| % OF GDP | |||||
| 2016 | 2017f | 2018f | 2019f | 2020f | |
| General government revenue | 54.0 | 52.3 | 50.9 | 50.7 | 50.8 |
| General government expenditure | 55.8 | 53.4 | 52.3 | 51.7 | 51.5 |
| General government primary expenditure | 54.7 | 52.5 | 51.5 | 50.9 | 50.7 |
| General government interest expenditure | 1.1 | 0.9 | 0.9 | 0.8 | 0.8 |
| General government net lending | –1.8 | –1.1 | –1.4 | –1.0 | –0.7 |
| Central government | –2.7 | –2.1 | –2.0 | –1.3 | –0.8 |
| Local government | –0.4 | –0.2 | –0.5 | –0.6 | –0.6 |
| Social security funds | 1.3 | 1.2 | 1.1 | 0.9 | 0.7 |
| General government primary balance | –0.7 | –0.2 | –0.6 | –0.2 | 0.1 |
| General government debt (EDP) | 63.1 | 61.8 | 61.3 | 61.4 | 60.8 |
| Central government debt | 47.5 | 46.9 | 46.9 | 46.8 | 46.1 |
| Tax ratio | 44.1 | 42.9 | 41.7 | 41.6 | 41.7 |
| Current prices, EUR billion | |||||
| General government net lending | –3.8 | –2.6 | –3.4 | –2.5 | –1.8 |
| Central government | –5.8 | –4.8 | –4.8 | –3.2 | –2.1 |
| Local government | –0.9 | –0.5 | –1.1 | –1.4 | –1.5 |
| Social security funds | 2.9 | 2.7 | 2.5 | 2.2 | 1.8 |
| General government debt (EDP) | 136.0 | 139.2 | 144.5 | 148.7 | 152.3 |
| Source: Bank of Finland. | |||||
| 10. BALANCE OF PAYMENTS | |||||
| EUR billion | |||||
| 2016 | 2017f | 2018f | 2019f | 2020f | |
| Exports of goods and services (SNA) | 76.0 | 84.8 | 90.5 | 95.3 | 100.0 |
| Imports of goods and services (SNA) | 78.6 | 83.4 | 88.2 | 92.8 | 97.1 |
| Goods and services account (SNA) | –2.6 | 1.4 | 2.3 | 2.5 | 2.9 |
| % of GDP | –1.2 | 0.6 | 1.0 | 1.0 | 1.2 |
| Investment income and other items, net (+ statistical discrepancy) | 2.2 | 1.2 | 0.4 | 0.4 | 0.5 |
| Current transfers, net | –2.5 | –2.6 | –2.8 | –2.8 | –3.0 |
| Current account, net | –3.0 | –0.3 | 0.0 | 0.1 | 0.4 |
| Net lending, % of GDP | |||||
| Private sector | 0.4 | 1.1 | 1.4 | 1.1 | 0.9 |
| Public sector | –1.8 | –1.1 | –1.4 | –1.0 | –0.7 |
| Current account, % of GDP | –1.4 | 0.0 | 0.0 | 0.0 | 0.2 |
| Source: Bank of Finland. | |||||
| 11. INTEREST RATES | |||||
| % | |||||
| 2016 | 2017f | 2018f | 2019f | 2020f | |
| 3–month Euribor1 | –0.3 | –0.3 | –0.3 | –0.1 | 0.1 |
| Average interest rate on new loan drawdowns2 | 1.9 | 1.8 | 1.9 | 2.0 | 2.2 |
| Average interest rate on the stock of loans2 | 1.5 | 1.4 | 1.4 | 1.5 | 1.7 |
| Average interest rate on the stock of deposits3 | 0.2 | 0.1 | 0.1 | 0.2 | 0.4 |
| Yield on Finnish 10-year government bonds1 | 0.4 | 0.5 | 0.7 | 0.9 | 1.1 |
| 1 Technical assumption derived from market expectations. | |||||
| 2 Finnish credit institutions’ loans to households and non–financial corporations (excl. overdrafts, credit card credits and repurchase agreements). | |||||
| 3 Finnish credit institutions’ deposits from households and non-financial corporations. | |||||
| Source: Bank of Finland. | |||||
| 12. INTERNATIONAL ENVIRONMENT | |||||
| The Eurosystem staff projections | |||||
| 2016 | 2017f | 2018f | 2019f | 2020f | |
| GDP, % change on previous year | |||||
| World | 3.0 | 3.6 | 3.6 | 3.6 | 3.5 |
| USA | 1.5 | 2.3 | 2.5 | 2.2 | 1.9 |
| Euro area | 1.8 | 2.4 | 2.3 | 1.9 | 1.7 |
| Japan | 1.0 | 1.5 | 1.0 | 0.7 | 0.1 |
| Imports, % change on previous year | |||||
| World | 2.0 | 5.5 | 4.5 | 4.2 | 3.8 |
| USA | 1.3 | 3.5 | 4.8 | 5.2 | 4.3 |
| Euro area | 4.7 | 5.1 | 5.2 | 4.4 | 3.9 |
| Japan | –2.3 | 2.6 | 3.0 | 3.7 | 2.0 |
| Index, 2010 = 100, and % change on previous year | |||||
| Import volume in Finnish export markets | 120.9 | 127.1 | 132.4 | 137.7 | 142.7 |
| 2.3 | 5.1 | 4.2 | 4.0 | 3.6 | |
| Export prices of Finland's trading competitors (excl. oil), national currencies | 105.9 | 110.5 | 113.5 | 116.0 | 118.6 |
| –2.1 | 4.3 | 2.8 | 2.2 | 2.2 | |
| Export prices of Finland's trading partners (excl. oil), in euro | 100.3 | 106.4 | 109.3 | 111.8 | 114.2 |
| –4.7 | 6.1 | 2.7 | 2.2 | 2.2 | |
| Industrial raw materials (excl. energy), HWWA index, in US dollars | 97.3 | 118.3 | 120.8 | 124.3 | 129.8 |
| –2.8 | 21.6 | 2.1 | 2.9 | 4.4 | |
| Oil price, USD per barrel1 | 44.0 | 54.3 | 61.6 | 58.9 | 57.3 |
| –15.9 | 23.3 | 13.4 | –4.3 | –2.7 | |
| Finland's nominal competitiveness indicator1 ,2 | 104.1 | 102.3 | 102.3 | 102.3 | 102.3 |
| 2.7 | –1.7 | 0.0 | 0.0 | 0.0 | |
| US dollar value of one euro1 | 1.11 | 1.13 | 1.17 | 1.17 | 1.17 |
| –0.2 | 1.9 | 4.1 | 0.0 | 0.0 | |
| 1 Technical assumption derived from market expectations. | |||||
| 2 Narrow plus euro area, 1999Q1 = 100 | |||||
| Source: Bank of Finland. | |||||
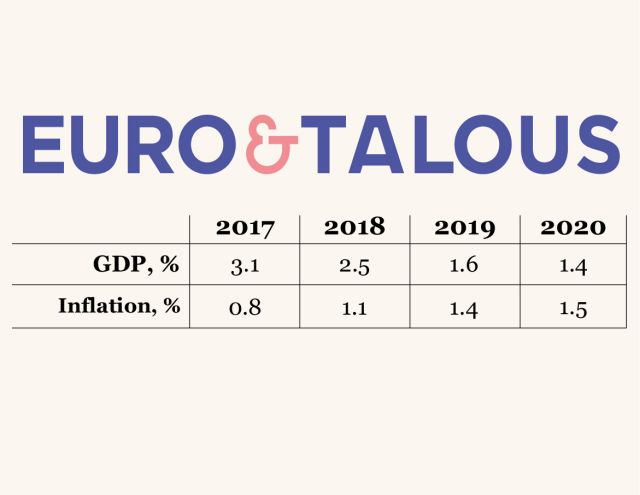
| 13. Current and June 2017 forecast | ||||
| 2017f | 2018f | 2019f | 2020f | |
| GDP, % change | 3.1 | 2.5 | 1.6 | 1.4 |
| June 2017 | 2.1 | 1.7 | 1.4 | |
| Inflation (HICP), % | 0.8 | 1.1 | 1.4 | 1.5 |
| June 2017 | 0.8 | 1.0 | 1.3 | |
| Current account, % of GDP | 0.0 | 0.0 | 0.0 | 0.2 |
| June 2017 | –1.2 | –0.9 | –0.8 | |
| General government net lending, % of GDP | –1.1 | –1.4 | –1.0 | –0.7 |
| June 2017 | –2.4 | –2.2 | –2.0 | |
| General government debt (EDP), % of GDP | 61.8 | 61.3 | 61.4 | 60.8 |
| June 2017 | 65.1 | 66.1 | 66.8 | |
| Unemployment rate, % | 8.6 | 8.2 | 7.9 | 7.6 |
| June 2017 | 8.6 | 8.2 | 8.1 | |
| Source: Bank of Finland. | ||||