Forecast
Forecast tables 2025–2028 (June 2026)
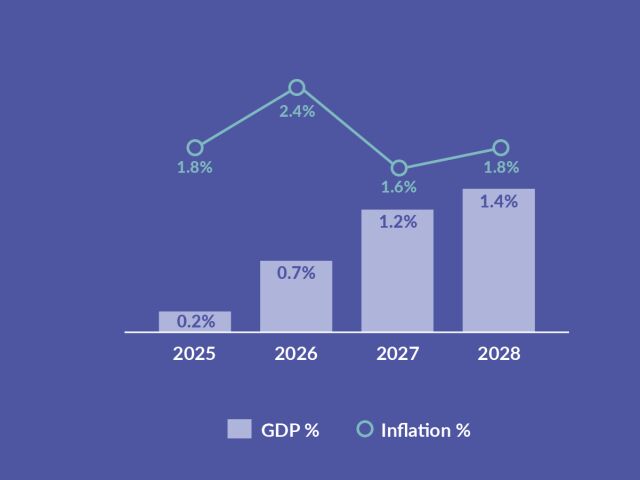
Despite the external challenges, the economy is forecast to grow at a gradually increasing rate. This year, growth will edge up to 0.7%, and in 2027 and 2028 it will rise to 1.2% and 1.4%, respectively. The inflation rate will increase this year to 2.4%, due to higher energy prices, but it will then moderate to around 1.7% in 2027 and 2028.
| % change on previous year | 2025 | 2026ᶠ | 2027ᶠ | 2028ᶠ |
|---|---|---|---|---|
| GDP at market prices | 0.2 | 0.7 | 1.2 | 1.4 |
| Imports of goods and services | 1.7 | 3.7 | 1.8 | 3.0 |
| Exports of goods and services | 3.4 | 1.7 | 2.4 | 3.1 |
| Private consumption | -0.2 | 0.8 | 1.2 | 1.3 |
| Public consumption | -0.2 | 0.0 | -0.2 | 0.5 |
| Private fixed investment | 0.4 | 3.3 | 2.1 | 3.3 |
| Public fixed investment | 2.4 | 17.9 | -0.4 | -2.5 |
| f=forecast. | ||||
| Sources: Bank of Finland and Statistics Finland. | ||||
| 2025 | 2026ᶠ | 2027ᶠ | 2028ᶠ | |
|---|---|---|---|---|
| GDP, % change | 0.2 | 0.7 | 1.2 | 1.4 |
| Net exports | 0.7 | -0.8 | 0.3 | 0.1 |
| Domestic demand excl. inventory change | -0.0 | 1.8 | 0.9 | 1.3 |
| of which Consumption | -0.2 | 0.4 | 0.6 | 0.8 |
| Investment | 0.2 | 1.4 | 0.4 | 0.5 |
| Inventory change + statistical discrepancy | -0.5 | -0.2 | -0.0 | 0.1 |
| 1 Bank of Finland calculations. Annual growth rates using the previous year's GDP shares at current prices as weights. f=forecast. |
||||
| Sources: Bank of Finland and Statistics Finland. | ||||
| Index 2015=100, and % change on previous year | 2025 | 2026ᶠ | 2027ᶠ | 2028ᶠ |
|---|---|---|---|---|
| GDP at market prices | 122.7 | 124.8 | 127.3 | 129.7 |
| 1.5 | 1.7 | 2.0 | 1.9 | |
| Imports of goods and services | 123.0 | 127.0 | 130.2 | 131.8 |
| -1.2 | 3.3 | 2.5 | 1.2 | |
| Exports of goods and services | 121.7 | 125.6 | 128.7 | 130.2 |
| -0.7 | 3.2 | 2.5 | 1.2 | |
| Private consumption | 120.6 | 123.5 | 125.6 | 128.0 |
| 1.1 | 2.4 | 1.7 | 1.9 | |
| Public consumption | 121.6 | 125.5 | 129.2 | 132.2 |
| 1.8 | 3.2 | 2.9 | 2.3 | |
| Private fixed investment | 127.2 | 128.7 | 131.7 | 133.6 |
| -0.0 | 1.2 | 2.3 | 1.4 | |
| Public fixed investment | 123.0 | 124.6 | 127.6 | 129.9 |
| -0.4 | 1.3 | 2.5 | 1.8 | |
| Terms of trade (goods and services) | 99.0 | 98.9 | 98.8 | 98.8 |
| 0.5 | -0.1 | -0.0 | -0.0 | |
| f=forecast. | ||||
| Sources: Bank of Finland and Statistics Finland. | ||||
| EUR million and % change on previous year | 2025 | 2026ᶠ | 2027ᶠ | 2028ᶠ |
|---|---|---|---|---|
| GDP at market prices | 280,570 | 287,468 | 296,683 | 306,713 |
| 1.7 | 2.5 | 3.2 | 3.4 | |
| Imports of goods and services | 115,228 | 123,417 | 128,757 | 134,211 |
| 0.5 | 7.1 | 4.3 | 4.2 | |
| Total supply | 395,798 | 410,885 | 425,440 | 440,924 |
| 1.3 | 3.8 | 3.5 | 3.6 | |
| Exports of goods and services | 118,756 | 124,627 | 130,800 | 136,544 |
| 2.7 | 4.9 | 5.0 | 4.4 | |
| Consumption | 215,585 | 222,583 | 228,970 | 236,044 |
| 1.1 | 3.2 | 2.9 | 3.1 | |
| Private | 142,447 | 147,049 | 151,375 | 156,231 |
| 0.9 | 3.2 | 2.9 | 3.2 | |
| Public | 73,138 | 75,534 | 77,595 | 79,812 |
| 1.5 | 3.3 | 2.7 | 2.9 | |
| Fixed investment | 61,260 | 65,897 | 68,477 | 70,880 |
| 0.6 | 7.6 | 3.9 | 3.5 | |
| Private | 48,773 | 50,982 | 53,256 | 55,777 |
| 0.3 | 4.5 | 4.5 | 4.7 | |
| Public | 12,487 | 14,915 | 15,220 | 15,103 |
| 2.0 | 19.4 | 2.0 | -0.8 | |
| Inventory change + statistical discrepancy | 197 | -2,223 | -2,807 | -2,544 |
| % of previous year's total demand | -0.2 | -0.6 | -0.1 | 0.1 |
| Total demand | 395,798 | 410,885 | 425,440 | 440,924 |
| 1.3 | 3.8 | 3.5 | 3.6 | |
| Total domestic demand | 277,042 | 286,257 | 294,640 | 304,380 |
| 0.7 | 3.3 | 2.9 | 3.3 | |
| f=forecast. | ||||
| Sources: Bank of Finland and Statistics Finland. | ||||
| % in proportion to GDP at current prices | 2025 | 2026ᶠ | 2027ᶠ | 2028ᶠ |
|---|---|---|---|---|
| GDP at market prices | 100.0 | 100.0 | 100.0 | 100.0 |
| Imports of goods and services | 41.1 | 42.9 | 43.4 | 43.8 |
| Exports of goods and services | 42.3 | 43.4 | 44.1 | 44.5 |
| Consumption | 76.8 | 77.4 | 77.2 | 77.0 |
| Private | 50.8 | 51.2 | 51.0 | 50.9 |
| Public | 26.1 | 26.3 | 26.2 | 26.0 |
| Fixed investment | 21.8 | 22.9 | 23.1 | 23.1 |
| Private | 17.4 | 17.7 | 18.0 | 18.2 |
| Public | 4.5 | 5.2 | 5.1 | 4.9 |
| Inventory change + statistical discrepancy | 0.1 | -0.8 | -0.9 | -0.8 |
| Total demand | 141.1 | 142.9 | 143.4 | 143.8 |
| Total domestic demand | 98.7 | 99.6 | 99.3 | 99.2 |
| f=forecast. | ||||
| Sources: Bank of Finland and Statistics Finland. | ||||
| Index 2015=100, and % change on previous year | 2025 | 2026ᶠ | 2027ᶠ | 2028ᶠ |
|---|---|---|---|---|
| Harmonised index of consumer prices, 2015=100 | 100.0 | 102.4 | 104.1 | 105.9 |
| 1.8 | 2.4 | 1.6 | 1.8 | |
| Harmonised index of consumer prices excl. energy and food, 2015=100 | 100.0 | 101.5 | 103.6 | 105.4 |
| 2.4 | 1.5 | 2.1 | 1.7 | |
| Consumer price index, 2015=100 | 100.0 | 101.9 | 103.8 | 105.6 |
| 0.3 | 1.9 | 1.8 | 1.8 | |
| Private consumption deflator | 120.6 | 123.5 | 125.6 | 128.0 |
| 1.1 | 2.4 | 1.7 | 1.9 | |
| Private investment deflator | 127.2 | 128.7 | 131.7 | 133.6 |
| -0.0 | 1.2 | 2.3 | 1.4 | |
| Exports of goods and services deflator | 121.7 | 125.6 | 128.7 | 130.2 |
| -0.7 | 3.2 | 2.5 | 1.2 | |
| Imports of goods and services deflator | 123.0 | 127.0 | 130.2 | 131.8 |
| -1.2 | 3.3 | 2.5 | 1.2 | |
| Value-added deflators | ||||
| Value added, gross at basic prices | 122.2 | 124.4 | 127.0 | 129.4 |
| 1.2 | 1.8 | 2.0 | 1.9 | |
| f=forecast. | ||||
| Sources: Bank of Finland and Statistics Finland. | ||||
| % change on previous year | 2025 | 2026ᶠ | 2027ᶠ | 2028ᶠ |
|---|---|---|---|---|
| Whole economy | ||||
| Index of wage and salary earnings | 3.1 | 3.5 | 3.3 | 2.6 |
| Compensation per employee | 2.6 | 3.3 | 3.1 | 2.5 |
| Unit labour costs | 1.8 | 2.4 | 2.5 | 1.8 |
| Productivity per employed person | 0.7 | 0.9 | 0.6 | 0.7 |
| f=forecast. | ||||
| Sources: Bank of Finland and Statistics Finland. | ||||
| 1,000 persons and % change on previous year | 2025 | 2026ᶠ | 2027ᶠ | 2028ᶠ |
|---|---|---|---|---|
| Labour force survey (15–74-year-olds) | ||||
| Employed persons | 2,589 | 2,585 | 2,600 | 2,619 |
| -0.6 | -0.1 | 0.6 | 0.7 | |
| Unemployed persons | 279 | 301 | 287 | 260 |
| 16.4 | 8.0 | -4.7 | -9.3 | |
| Labour force | 2,867 | 2,885 | 2,887 | 2,879 |
| 0.9 | 0.6 | 0.1 | -0.3 | |
| Working-age population (15–64-year-olds) | 3,493 | 3,510 | 3,528 | 3,545 |
| 0.6 | 0.5 | 0.5 | 0.5 | |
| Labour force participation rate, % | 68.8 | 69.0 | 68.8 | 68.3 |
| Unemployment rate, % | 9.7 | 10.4 | 9.9 | 9.0 |
| Employment rate (20–64-year-olds), % | 76.0 | 75.5 | 75.6 | 75.7 |
| f=forecast. | ||||
| Sources: Bank of Finland and Statistics Finland. | ||||
| 2025 | 2026ᶠ | 2027ᶠ | 2028ᶠ | |
|---|---|---|---|---|
| % relative to GDP | ||||
| General government revenue | 54.0 | 54.1 | 53.3 | 53.1 |
| General government expenditure | 57.4 | 58.3 | 58.1 | 57.6 |
| General government primary expenditure | 55.8 | 56.7 | 56.2 | 55.5 |
| General government interest expenditure | 1.6 | 1.7 | 1.9 | 2.1 |
| General government net lending | -3.4 | -4.2 | -4.8 | -4.5 |
| Central government | -3.9 | -4.9 | -4.9 | -5.2 |
| Local government | -0.3 | -0.4 | -0.7 | -0.7 |
| Social security funds | 0.7 | 1.1 | 0.8 | 1.3 |
| General government primary balance | -1.8 | -2.6 | -2.9 | -2.4 |
| General government structural balance¹ | -2.1 | -3.1 | -3.9 | -4.1 |
| General government debt (EDP) | 88.5 | 91.9 | 94.1 | 96.9 |
| Central government debt | 66.9 | 70.5 | 72.9 | 75.8 |
| Tax ratio | 42.5 | 42.5 | 42.0 | 41.8 |
| Current prices, EUR billion | ||||
| General government net lending | -9.6 | -12.2 | -14.2 | -13.9 |
| Central government | -10.9 | -14.2 | -14.5 | -15.8 |
| Local government | -0.7 | -1.1 | -2.1 | -2.2 |
| Social security funds | 2.0 | 3.1 | 2.4 | 4.1 |
| General government debt (EDP) | 248.4 | 264.1 | 279.3 | 297.2 |
| 1Based on the cyclical adjustment method used by the European System of Central Banks. f=forecast. |
||||
| Sources: Bank of Finland and Statistics Finland. | ||||
| EUR billion | 2025 | 2026ᶠ | 2027ᶠ | 2028ᶠ |
|---|---|---|---|---|
| Exports of goods and services (SNA)1 | 118.8 | 124.6 | 130.8 | 136.5 |
| Imports of goods and services (SNA)1 | 115.2 | 123.4 | 128.8 | 134.2 |
| Goods and services account (SNA)1 | 3.5 | 1.2 | 2.0 | 2.3 |
| % of GDP | 1.3 | 0.4 | 0.7 | 0.8 |
| Investment income and other items, net (+ statistical discrepancy) | 1.8 | 0.7 | 0.7 | 0.7 |
| Current transfers, net | -1.4 | -2.1 | -2.6 | -3.0 |
| Current account, net | 3.5 | 0.9 | 0.2 | -0.0 |
| Net lending, % of GDP | ||||
| Private sector | 4.7 | 4.6 | 4.8 | 4.5 |
| Public sector | -3.4 | -4.2 | -4.8 | -4.5 |
| Current account, % of GDP | 1.3 | 0.3 | 0.1 | -0.0 |
| 1SNA = System of National Accounts f=forecast. |
||||
| Sources: Bank of Finland and Statistics Finland. | ||||
| % | 2025 | 2026ᶠ | 2027ᶠ | 2028ᶠ |
|---|---|---|---|---|
| 3-month Euribor1 | 2.2 | 2.4 | 2.8 | 2.7 |
| Yield on Finnish 10-year government bonds1 | 3.0 | 3.4 | 3.6 | 3.8 |
| 1Technical assumption derived from market expectations. f=forecast. |
||||
| Sources: European Central Bank and Bank of Finland. | ||||
| Eurosystem staff projections | 2025 | 2026ᶠ | 2027ᶠ | 2028ᶠ |
|---|---|---|---|---|
| GDP, % change on previous year | ||||
| World (excl. euro area) | 3.6 | 3.0 | 3.2 | 3.3 |
| USA | 2.1 | 2.1 | 1.8 | 1.9 |
| Euro area | 1.5 | 0.8 | 1.2 | 1.5 |
| Japan | 1.2 | 0.4 | 0.7 | 0.8 |
| Imports, % change on previous year | ||||
| World (excl. euro area) | 5.5 | 4.2 | 3.6 | 3.5 |
| USA | -1.2 | 5.6 | 4.0 | 2.6 |
| Euro area | 3.9 | 1.3 | 2.4 | 3.0 |
| Japan | -1.5 | 2.0 | 3.1 | 2.5 |
| Index, 2015=100, and % change on previous year | ||||
| Import volume in Finnish export markets | 126.4 | 129.8 | 133.5 | 137.6 |
| 4.1 | 2.7 | 2.8 | 3.1 | |
| Export prices of Finland's trading partners, national currencies | 130.2 | 134.5 | 137.6 | 139.9 |
| 0.6 | 3.3 | 2.3 | 1.6 | |
| Export prices of Finland's trading partners, in EUR | 123.3 | 126.5 | 129.5 | 131.6 |
| -1.4 | 2.6 | 2.4 | 1.6 | |
| Industrial raw materials (excl. energy), HWWA index, in USD | 161.2 | 166.0 | 167.4 | 164.2 |
| 5.8 | 3.0 | 0.8 | -1.9 | |
| Oil price, USD/barrel1 | 69.1 | 96.9 | 82.2 | 77.1 |
| -14.9 | 40.1 | -15.1 | -6.2 | |
| Finland's nominal effective exchange rate2 | 105.6 | 106.4 | 106.3 | 106.3 |
| -2.0 | -0.7 | 0.1 | 0.0 | |
| US dollar value of one euro3 | 1.1 | 1.2 | 1.2 | 1.2 |
| 4.4 | 3.5 | -0.1 | 0.0 | |
| 1Technical assumption derived from market expectations. 2Broad nominal effective exchange rate, January – March 2015 = 100. The index rises as the currency depreciates. Assuming no changes in the exchange rate. 3Assuming no changes in the exchange rate. f=forecast. |
||||
| Sources: European Central Bank and Bank of Finland. | ||||
| 2025 | 2026ᶠ | 2027ᶠ | 2028ᶠ | |
|---|---|---|---|---|
| GDP, % change | 0.2 | 0.7 | 1.2 | 1.4 |
| December 2025 | 0.2 | 0.8 | 1.7 | 1.5 |
| Inflation (HICP), % | 1.8 | 2.4 | 1.6 | 1.8 |
| December 2025 | 1.8 | 1.4 | 1.7 | 1.9 |
| Employment rate (20–64-year-olds), % | 76.0 | 75.5 | 75.6 | 75.7 |
| December 2025 | 76.1 | 76.2 | 76.5 | 76.6 |
| Unemployment rate, % | 9.7 | 10.4 | 9.9 | 9.0 |
| December 2025 | 9.7 | 9.9 | 9.3 | 8.9 |
| Current account, % of GDP | 1.3 | 0.3 | 0.1 | -0.0 |
| December 2025 | 1.1 | 0.2 | 0.3 | 0.4 |
| General government net lending, % of GDP | -3.4 | -4.2 | -1.9 | -4.5 |
| December 2025 | -3.7 | -4.3 | -4.1 | -3.9 |
| General government debt (EDP), % of GDP | 88.5 | 91.9 | 94.1 | 96.9 |
| December 2025 | 88.2 | 90.6 | 91.4 | 93.0 |
| f=forecast. | ||||
| Sources: Bank of Finland and Statistics Finland. | ||||